Exercise is great for your heart – this we know. Endurance athletes, such as cyclists, runners and rowers, undergo higher amounts of cardiac remodeling than many other types of athletes. It is a necessary adaptation to the demands placed on their bodies. The heart is responsible for nutrient and oxygen delivery to the brain, liver and working muscle, removal of CO2 as blood circulates through the lungs, as well as feeding itself. It is the one muscle that never ceases to work, contracting around 100,000 times per day.
There are many ways to analyze the health of the heart: an electrocardiograph (EKG or ECG, which measures the electrical activity), an echocardiogram (which uses ultrasound to get a video or still image of the heart’s anatomy), and through more invasive measures such as a transesophageal echocardiogram (TEE) or catheter.
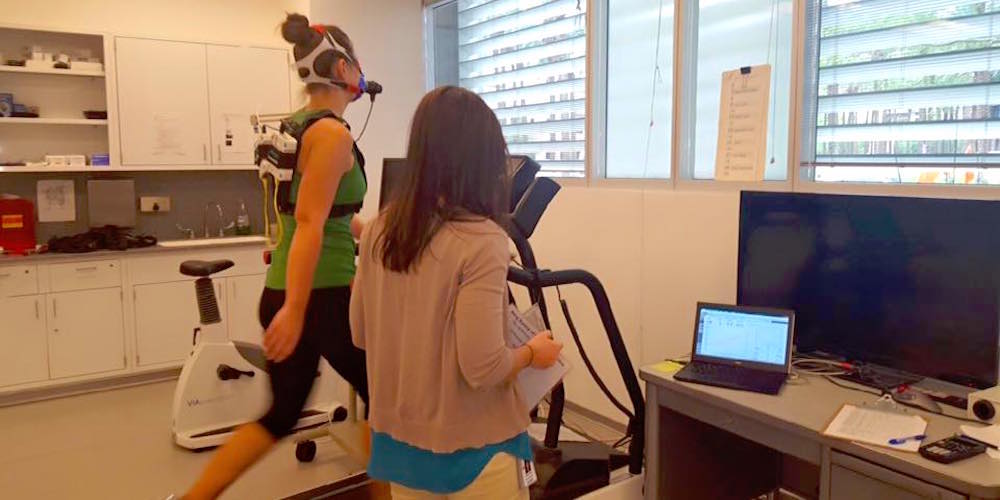
While on shift in the telemetry room at Abrazo Arizona Heart Hospital, I decided to hook myself up to a telemetry monitor. The monitor is essentially a 5-lead EKG used when patients need their cardiac rhythm monitored for an extended period of time. The reasoning was three-fold:
- I had been under a decent amount of stress.
- I’m highly athletic.
- I had been watching a ton of House.
What I saw that was expected: Sinus bradycardia (sitting in my chair looking at the monitor, my heart rate was around 48-52 bpm), an increased QRS voltage (due to left ventricular hypertrophy) and sinus arrhythmia (confirmation of what I already knew was true due to frequent palpation of my brachial pulse). According to a 2009 study published in the journal Circulation, nearly 2/3 of athletes have at least some minor alteration present on an EKG.
What I saw that was somewhat unexpected (based on my knowledge at the time): ST segment elevation in leads II and aVF, and a small J wave after my QRS complex in leads I and II.
I decided to do a second analysis about five hours later. I applied new electrodes and reattached the monitor leads. This time, the ST elevation in leads II and aVF was slightly less (~1.2 mm in II compared to ~1.6 mm earlier), and I still had a J wave.
I am a 32 year old, pretty damn fit female. I do not suffer from angina at rest or during exertion, nor any other female-specific symptoms of a myocardial infarction or pericarditis. What is the clinical etiology of this?
The results motivated a natural leap into the depths of PubMed’s rabbit hole, and I ended up finding some pretty fascinating information.
The basics of cardiovascular remodeling in response to exercise.
One of the major affects of chronic aerobic training is left ventricular hypertrophy – basically, your heart muscle cells get bigger, just as your legs would in response to frequent cycling or squats. The increased strength gained from myocardial hypertrophy allows the heart to pump out more blood with each contraction, resulting in several things, such as an increased ejection fraction and stroke volume, as well as a lower resting heart rate.
Other adaptations are apparent during the time before the heart contracts, called preload. The concept of improved preload and end diastolic volume stems from a higher venous return (more blood is being returned to the heart), improved ventricular stretching (the ventricles can accommodate a larger blood volume), and a longer filling time during diastole (when the heart is at rest between beats).
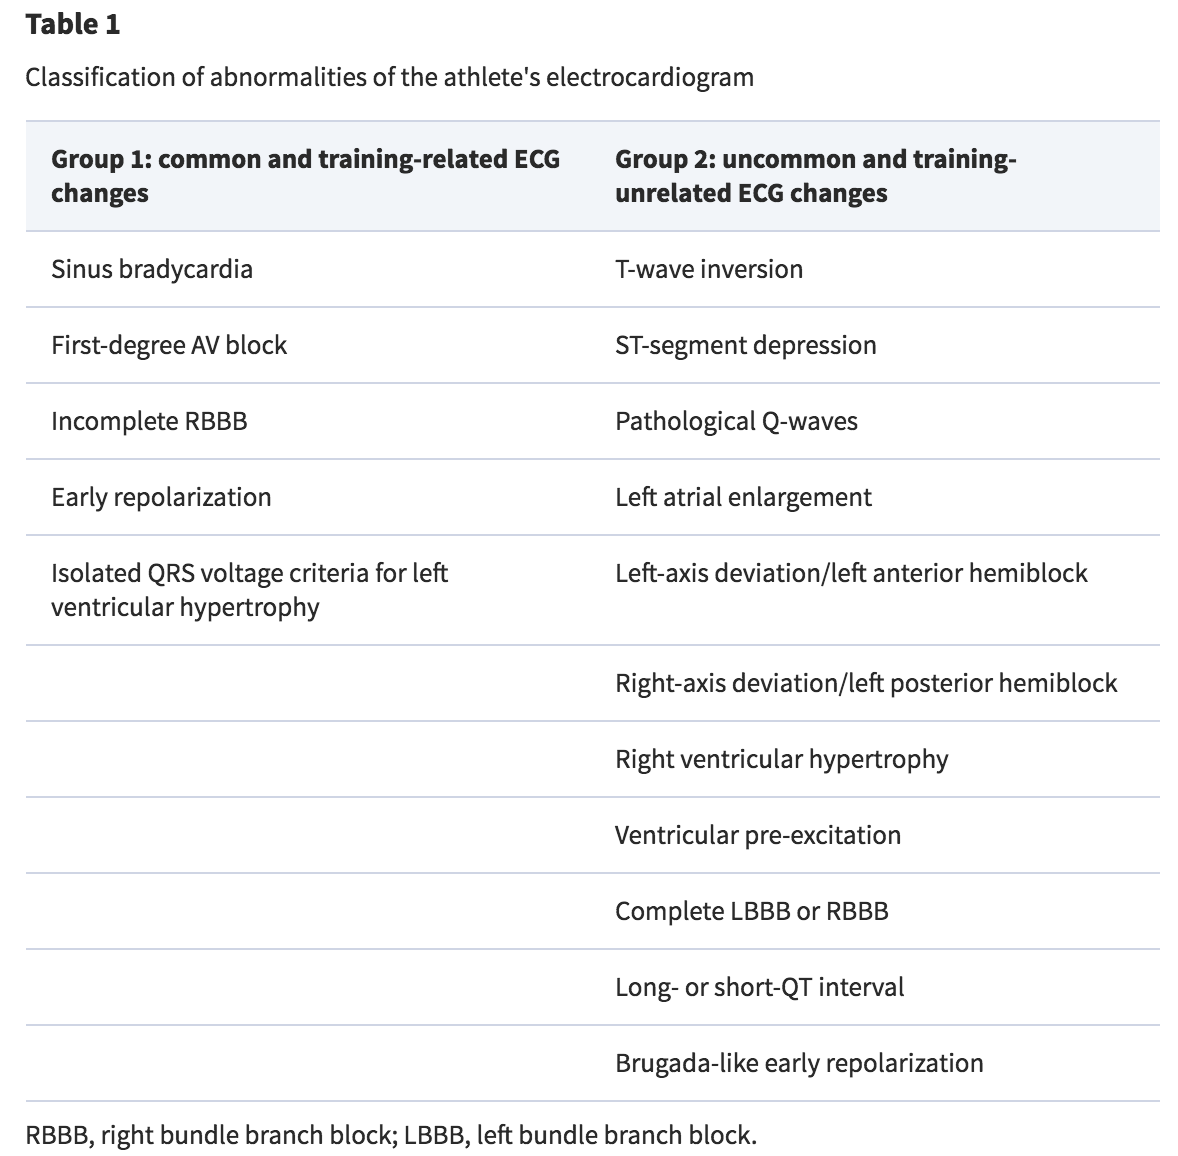
Many of these heart-healthy improvements can be seen on an EKG or other clinical tool, but they do not necessarily appear as expected. Furthermore, in athletic populations, abnormailites seen on an EKG are rarely associated with cardiovascular-related disorders or disease (<5%, according to Pelliccia et al., 2000). Let’s go through each of the findings mentioned in the introduction.
Bradycardia is the term used for a heart rate below 60 bpm (the average heart rate for a healthy adult is 60-90 bpm). Most endurance athletes have a resting heart rate that is classified as brady (I’ve seen mine at 40 bpm). The explanations are fairly simple: the stronger the heart, the more blood it can eject with each contraction, therefore, the less contractions it has to make every minute. Adding to bradycardia is an increase in vagal (parasympathetic) tone, which influences the lowering of one’s heart rate.
The mathematical equation that illustrates this concept is this: Q = SV x HR, where Q is cardiac output (in liters/minute), SV is stroke volume (in liters/beat), and HR is heart rate (in beats/minute). The inverse relationship between SV and HR proves the aforementioned explanation, where for any given Q, a higher SV leads to a lower HR.
Sinus arrhythmia is seen in up to 70% of athletes, and associated with an increase in vagal tone (Corrado et al., 2010).
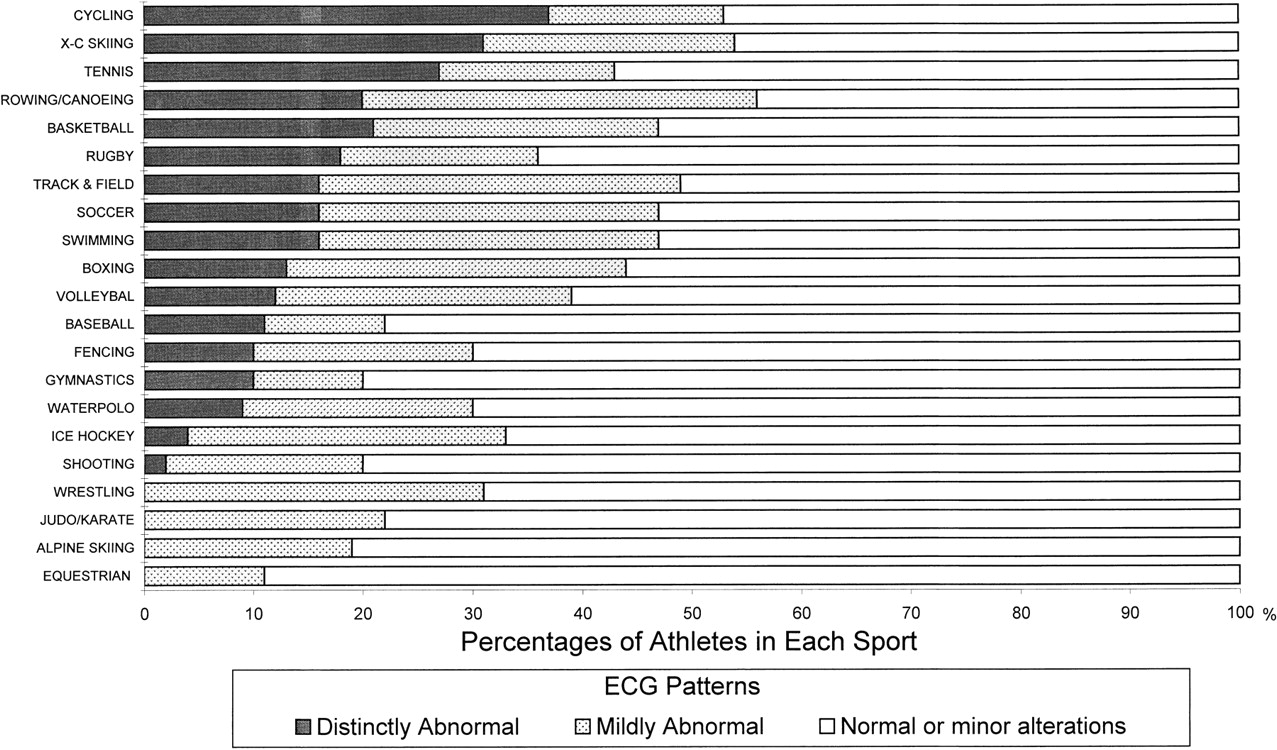
An increased QRS voltage indicates increased left ventricular dimensions and hypertrophy. These findings are typical and more often seen in cyclists, cross-country skiers and runners, and rowers – all endurance athletics.
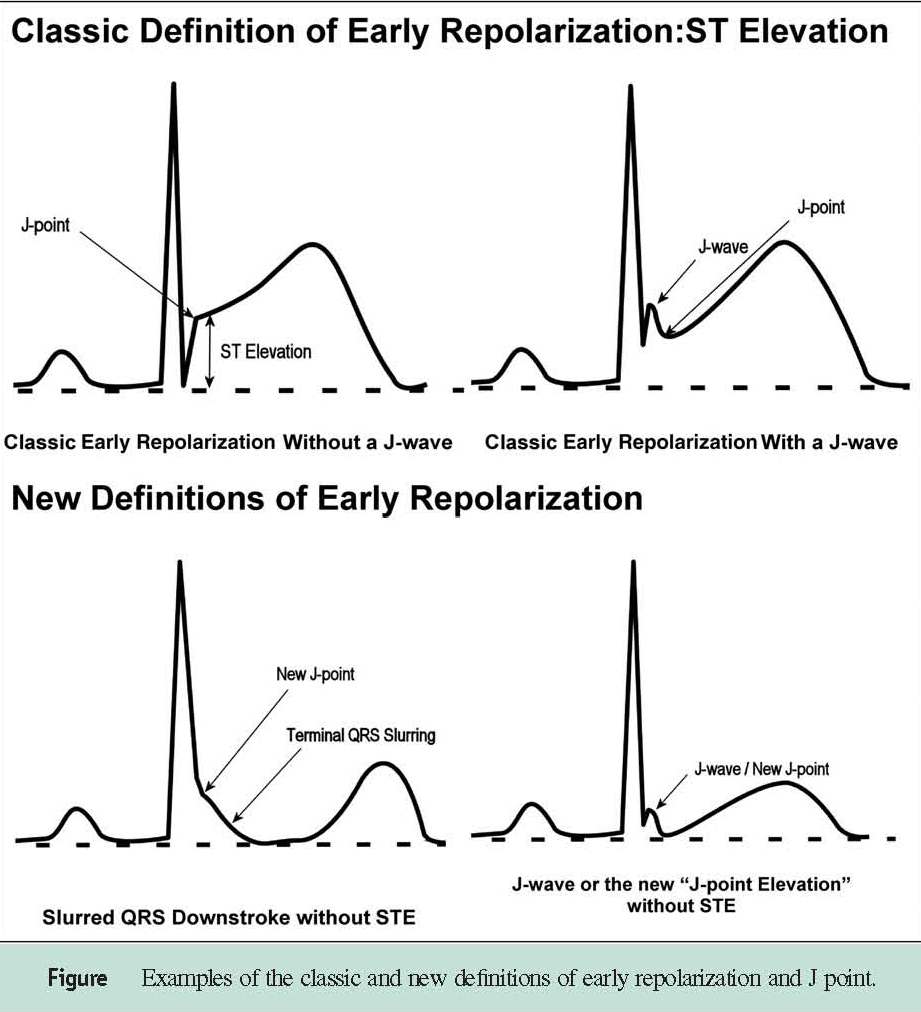
ST segment elevation is clinically indicative of cardiac ischemia – lack of blood flow (and oxygen delivery) to the heart. In clinical populations is typically due to an occlusion in the coronary arteries; however, in athletes, it is associated with early repolarization and is regarded as benign. It typically presents with an upward sweep (concave) into the T wave and usually disappears during exercise or deconditioning.
A J wave is typically indicative of early ventricular repolarization, and in individuals that lack a diagnosis of heart disease, it denotes an increased risk for ventricular arrhythmias and cardiac arrest. When present, it is often seen with ST segment elevation, however, it is pretty common in athletes, seen in up to 44% of athlete EKGs. Does this mean those individuals are at an increased risk for cardiac arrest? Not at all. What must be taken into account are the other changes associated with training, like left ventricular remodeling and a decreased resting heart rate/improved vagal tone.
For more detail, check out this presentation by Dr. Antonio Pelliccia, MD., Chief of Cardiology at the Institute of Sports Medicine and Science and The Italian National Olympic Committee, Rome.
If you’d like to hone your dysrhythmia diagnostic skills, check out our ECG Knowledge Bank.
References:
Corrado, D., Pelliccia, A., Heidbuchel, H., Sharma, S., Link, M., Basso, C., … & Anastasakis, A. (2010). Recommendations for interpretation of 12-lead electrocardiogram in the athlete. European heart journal, 31(2), 243-259.
Pelliccia, A., Maron, B. J., Culasso, F., Di Paolo, F. M., Spataro, A., Biffi, A., … & Piovano, P. (2000). Clinical significance of abnormal electrocardiographic patterns in trained athletes. Circulation, 102(3), 278-284.
Pelliccia, A., & Quattrini, F. M. (2015). Clinical significance of J-wave in elite athletes. Journal of electrocardiology, 48(3), 385-389.